MySuper dashboard
Welcome to the MySuper dashboard
Here, you will find the most up-to-date return and investment figures for First Super’s MySuper product which is our Balanced investment option.
Return Target
Achieve an investment return (after tax and investment expenses) exceeding inflation, as measured by the Consumer Price Index, by at least 3.10%1 per annum over rolling 10-year periods. The return target is a prediction and cannot be guaranteed.
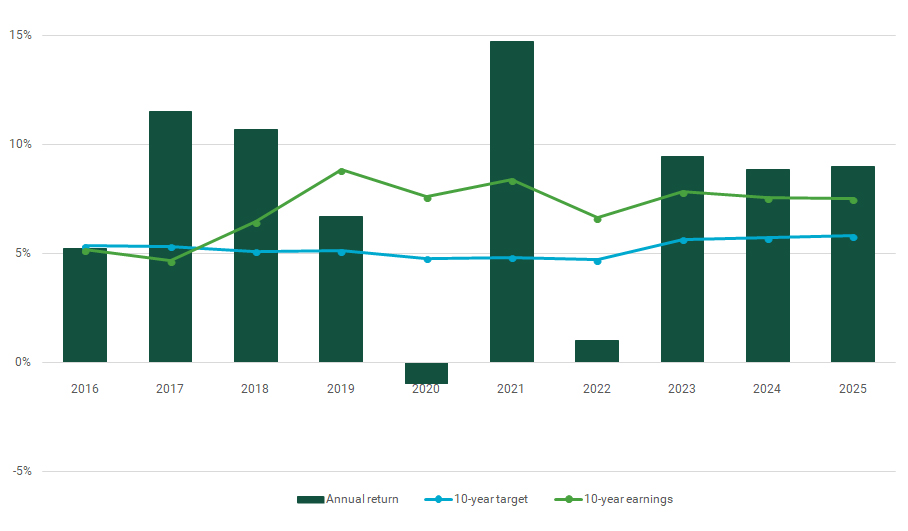
Return
The average return for the 10 years to 30 June 2025 was 7.52% p.a. Individual financial year returns are provided below.
| Financial Year Ending 30 June | Return % |
|---|---|
| 2025 | 9.00 |
| 2024 | 8.87 |
| 2023 | 9.44 |
| 2022 | 1.00 |
| 2021 | 14.73 |
| 2020 | -0.95 |
| 2019 | 6.70 |
| 2018 | 10.68 |
| 2017 | 11.50 |
| 2016 | 5.24 |
| 2015 | 9.41 |
| 2014 | 11.60 |
Your super account earns investment income at the Fund’s declared crediting rate. The crediting rate used will depend on the investment option(s) you have selected. More information about crediting rates can be found in the More About First Super booklet and the Your Retirement PDS. The actual returns are based on the performance of the underlying investments and First Super does not guarantee or promise any specific rate of return.
Comparison between return target and return
Level of investment risk
- High
- Negative returns expected in 4.5 out of every 20 years
The higher the expected return target, the more often you would expect a year of negative returns.
Statement of fees and other costs
$465.80 per year.
Estimate of fees and other costs for a member with a $50,000 balance who does not incur any additional activity fees. Investment fees are an estimate based on the 2026/27 financial year. Fees charged in subsequent financial years will depend on the actual costs incurred in those years. Past costs may not necessarily be an indicator of future costs.
What is the standard risk measure?
The Standard Risk Measure allows you to compare investment options on the basis of investment volatility. The lower the risk band number, the less likely an investment option will deliver a negative return. The First Super MySuper product aims to have a lower risk band than the average MySuper option. The Australian Prudential Regulation Authority (APRA) requires all super funds use the Standard Risk Measure to grade investment options (see table below).
| Risk Band | Risk Label | Estimated number of negative annual returns over any 20 year period |
|---|---|---|
| 1 | Very low | Less than 0.5 |
| 2 | Low | 0.5 to less than 1 |
| 3 | Low to medium | 1 to less than 2 |
| 4 | Medium | 2 to less than 3 |
| 5 | Medium to high | 3 to less than 4 |
| 6 | High | 4 to less than 6 |
| 7 | Very high | 6 or greater |
Important Note: The Trustee does not suggest or imply that Standard Risk Measure is a realistic or reliable measure of investment risk. In particular, the Trustee points out that:
- it contains no estimate of the potential size of an estimated negative return
- it provides no measure for the risk that a positive return might be less than you need to meet your investment objectives
- there is no sound reason to assume investment markets in the future will mirror projections or actual risk–performance in the past
- it is not clear that there is sufficient reliable information to make a 20-year projection in circumstances that have, and continue to, emerge following the global financial crisis.
How is the MySuper option invested?
The strategic asset allocation provides a breakdown of assets that the MySuper (Balanced investment option) is invested in and the percentage invested in each asset.
If you require more information on how to pick the right MySuper fund for you, please visit the Money Smart website.
We’re here to help, so get in touch.
If you have any questions, please call our Member Services Team on 1300 360 988, or email us.
1 After administration and advice costs